
Back to VantageWATCHLIST

Trackable watchlist

A single list where target buy and sell prices, alert status, and thesis notes live next to the live quote for each ticker.

Use the workspace to track distance to target, toggle price alerts on or off, and keep short-form thesis notes attached to each ticker.

3-Day full access trial · $24/mo thereafterCancel anytime in 1 clickFree Explorer tier forever
What it covers

What this capability surfaces

A grounded list of the features and outputs the matching workspace surface delivers today. Each row below maps directly to the corresponding element of the live product — nothing is aspirational or invented.

Illustrative Capability View
  1. 01
    Tabbed list

    Three tabs: All tickers, tickers with alerts enabled, and tickers with targets set.

  2. 02
    Live quotes

    Live price and day change on every row.

  3. 03
    Buy & sell targets

    Optional target buy and target sell prices per ticker, with the row showing distance to target.

  4. 04
    Alerts toggle

    Per-ticker alert toggle and remove action.

  5. 05
    Thesis notes

    Side-panel evaluator that opens the attached thesis notes for a single ticker.

How it works

Inputs, analysis, outputs

A high-level description of how the capability goes from raw inputs to the outputs you see inside the workspace.

  1. 01Step 1

    Inputs

    Tickers you add to the watchlist, optional target buy and target sell prices, optional alert toggles, and optional thesis notes.

  2. 02Step 2

    Tracking

    The workspace keeps your list, targets, and notes. Live quotes are fetched and merged with your targets so each row shows where price sits relative to your plan.

  3. 03Step 3

    Outputs

    A tabbed watchlist, a row-level evaluate panel, and a clear view of which tickers have alerts on, targets set, or notes attached.

Illustrative Workspace View

See it in the workspace

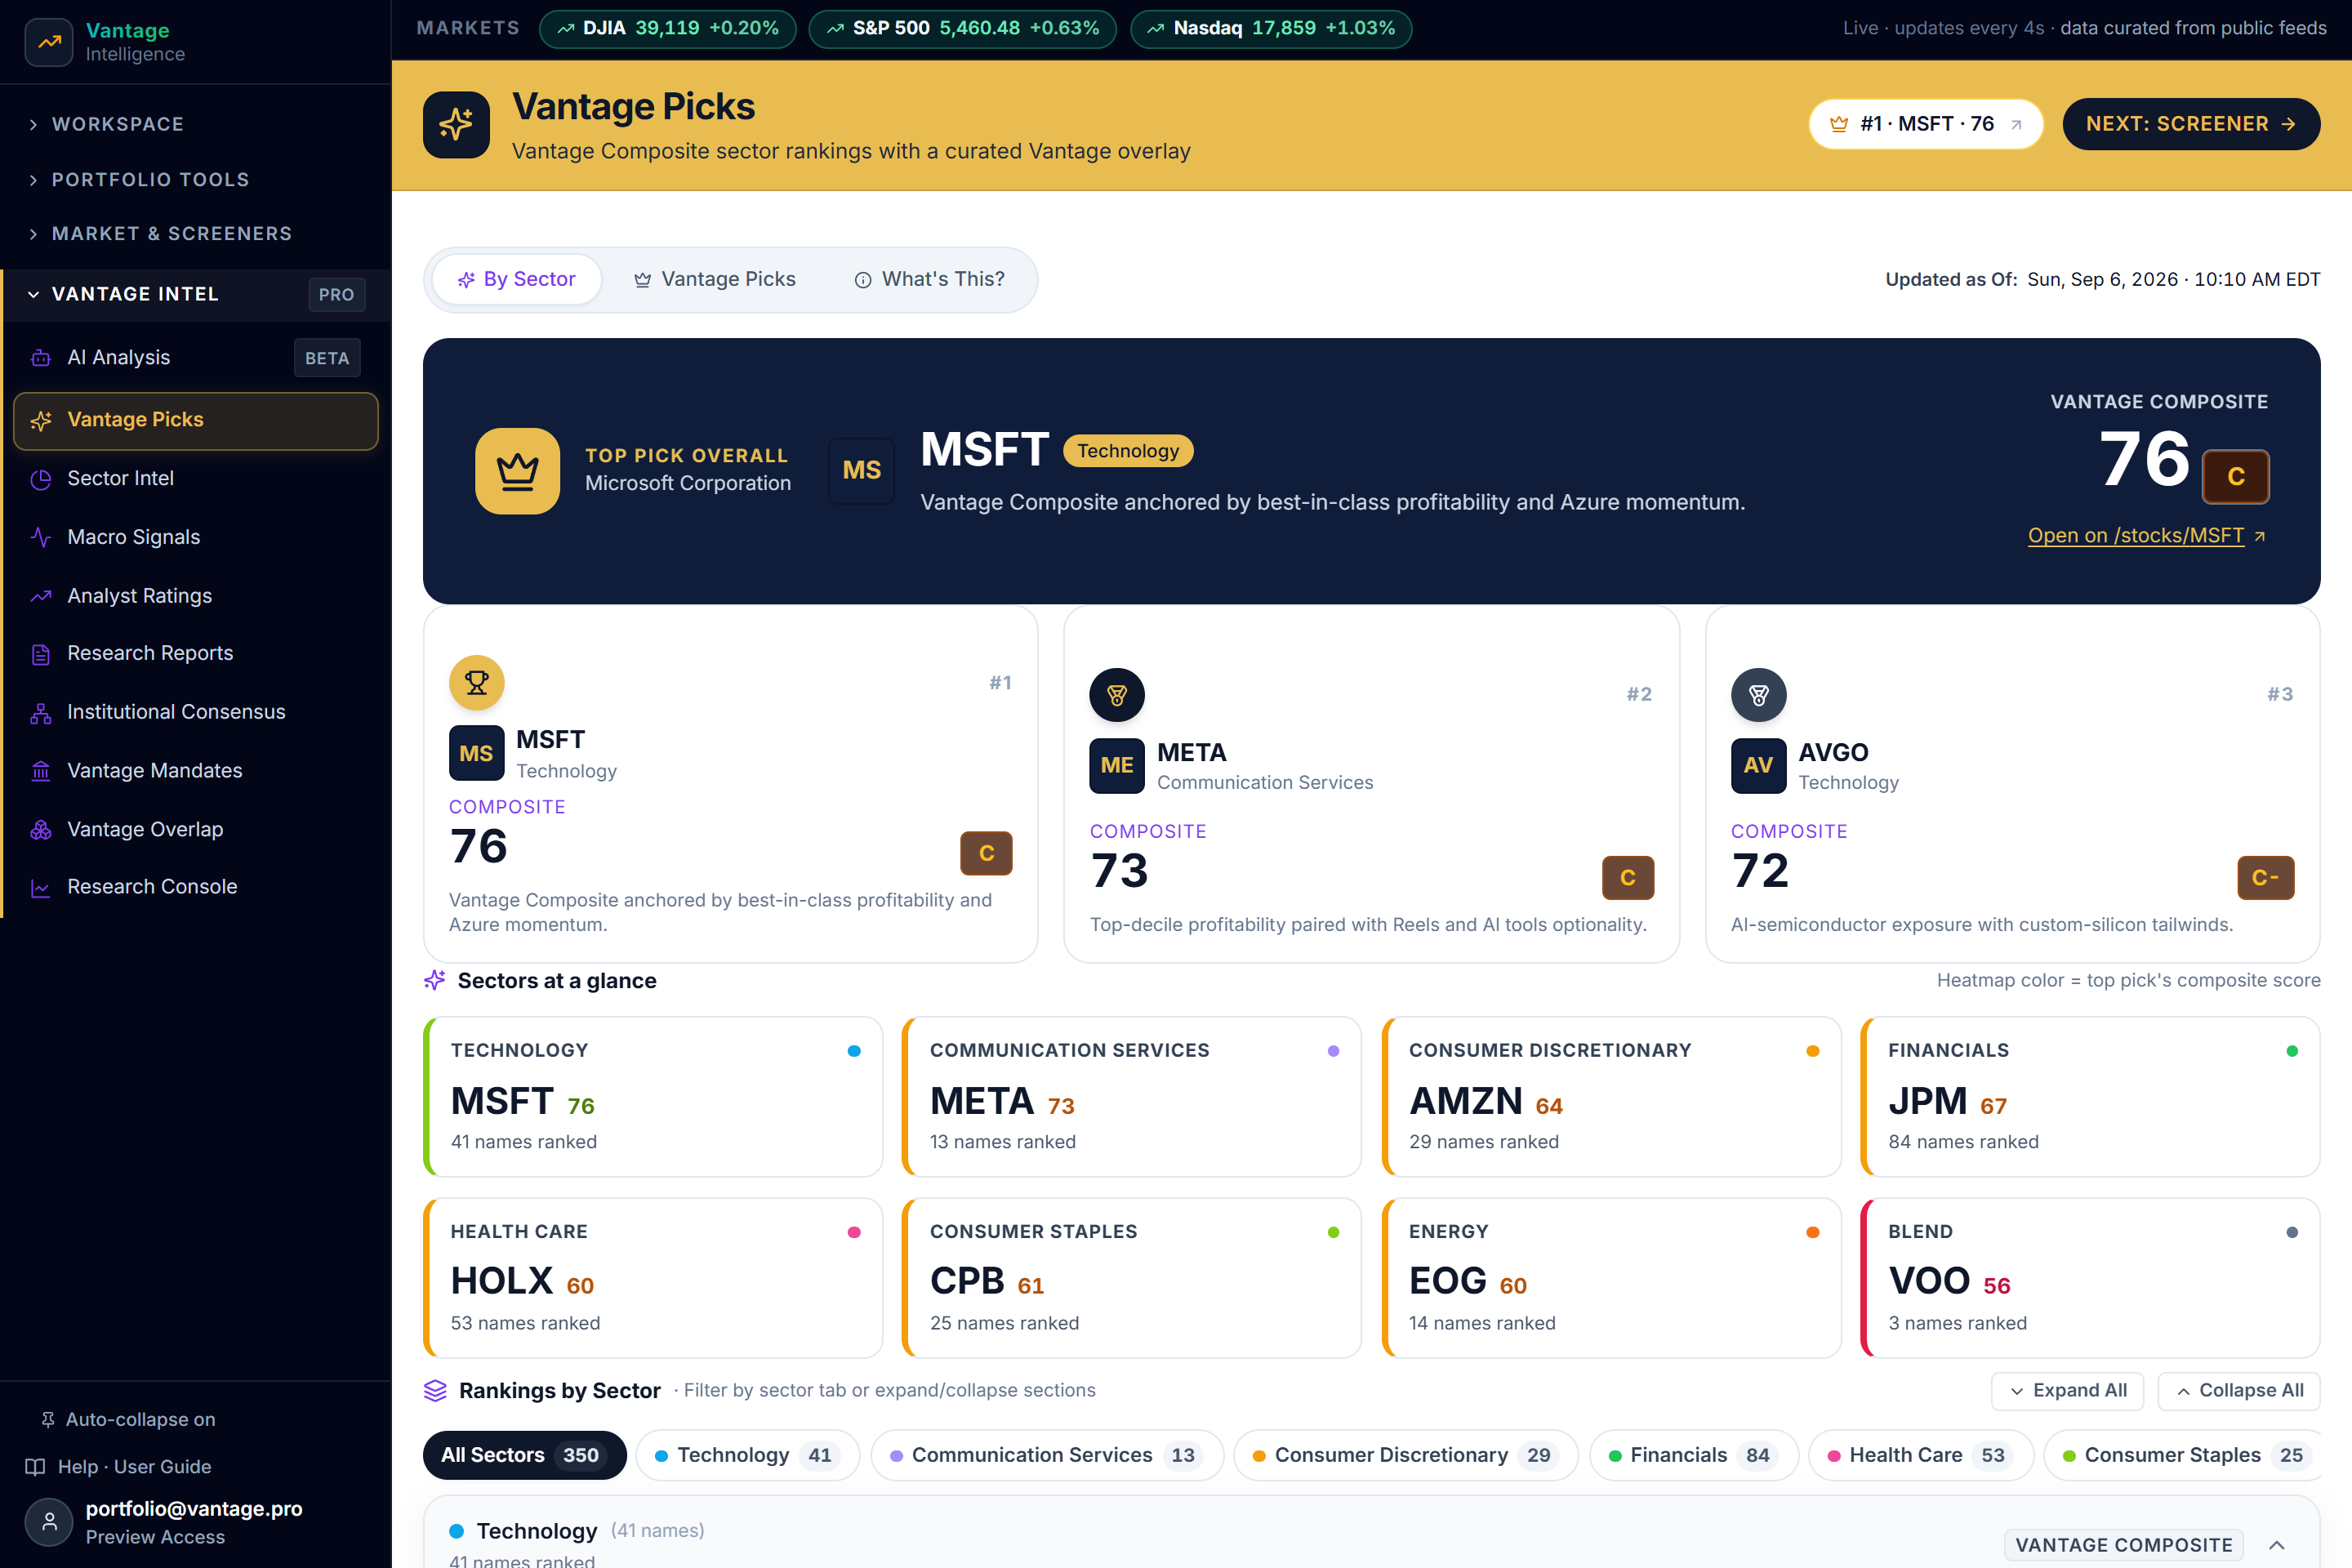
Daily factor alpha rankings, podium conviction plays, and target price pipelines in the Vantage Picks workspace.

Trackable watchlist

Illustrative workspace preview
Vantage Picks Live UI showing Podium Cards and Sector Heatmaps.

Illustrative workspace view. Data and labels are shown for demonstration and research context only.

Example outputs

What a typical result looks like

Illustrative examples showing the kind of labels and values the workspace surface produces. Numbers shown are placeholders, not live recommendations.

  • IllustrativeTabsAll · Alerts on · With targets
  • IllustrativeRowLive price · Day change · Target distance
  • IllustrativeAlertsPer-ticker toggle
  • IllustrativeTargetsOptional buy and sell prices per ticker
  • IllustrativeThesisShort notes attached to each ticker

Example values shown above are illustrative. The workspace always displays real values where the underlying data source is available.

ILLUSTRATIVE WORKSPACE SNAPSHOT

Illustrative watchlist view

Three example rows across five planning columns — em-dash placeholders only.

Example rows

Three rows · em-dash placeholders only · qualitative placeholders.

Example security A
Price context
—
Range context
—
Alert status
—
Thesis status
—
Example security B
Price context
—
Range context
—
Alert status
—
Thesis status
—
Example security C
Price context
—
Range context
—
Alert status
—
Thesis status
—

Em-dash placeholders indicate the slot exists; they do not represent any actual entry, alert, or planning state.

Illustrative research context only. It is not personalized investment advice, a recommendation, a price target, or a guarantee of future results.

Rows use em-dash placeholders only. Non-security cells are user-defined personal planning aids.

Use it responsibly

Limitations and responsible-use disclosures

  • Targets, alerts, and thesis notes are user-defined; the platform does not auto-generate buy or sell signals.
  • Live prices can be delayed or unavailable depending on the data source. Always verify a quote before acting on a target.
  • Targets are personal planning aids, not guaranteed outcomes. Markets involve risk and losses are possible.

This product provides information and research tools and does not provide personalized investment advice. Markets involve risk and losses are possible. You are responsible for your own investment decisions and the associated risk. Independently review any data, AI output, or rating before acting on it.

Ready when you are

Unlock the Full Quantitative Terminal.

Start your 3-day risk-free trial to access all 10 quantitative workspaces, daily Vantage Picks, and multi-horizon forward forecasts. Cancel anytime in 1 click.