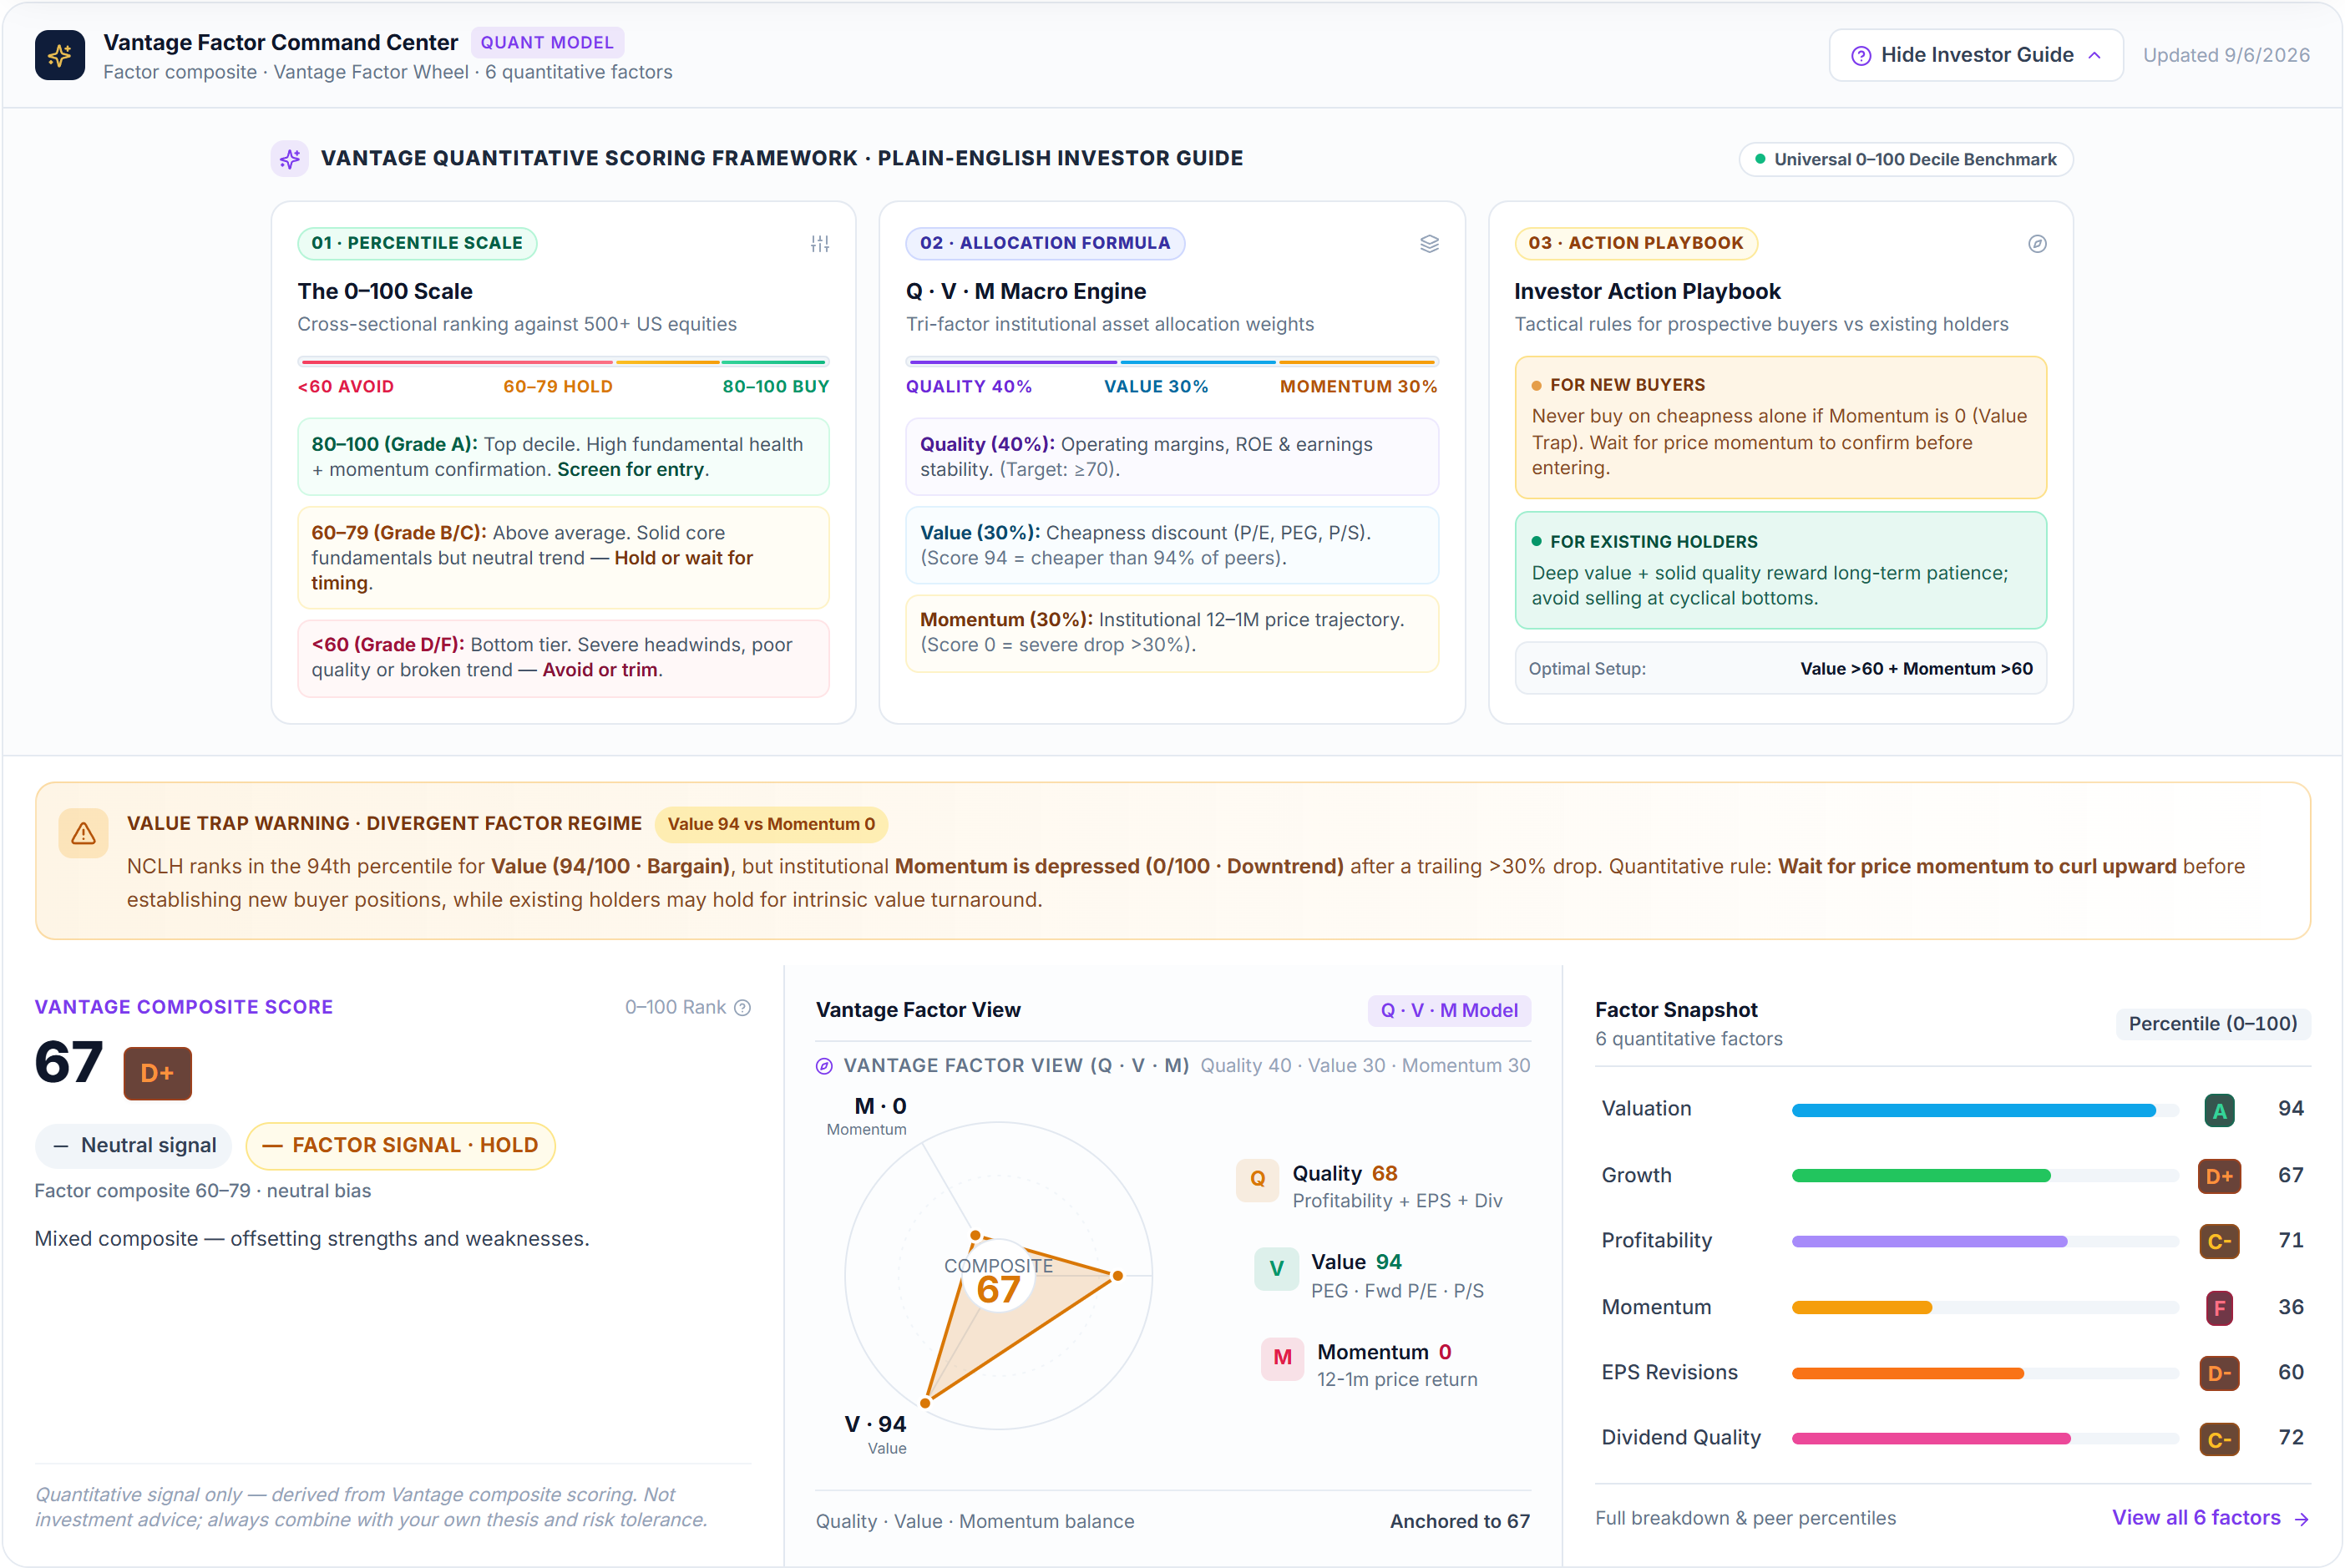
An Overall Rating score from 0 to 100 plus letter grades across six dimensions that feed it.
Each ticker is graded on Growth, Valuation, Efficiency, Dividends, Momentum, and EPS Revisions. The composite score, letter grade, and percentile rank are surfaced together so you can compare names side by side and see which dimension is driving the result.
3-Day full access trial · $24/mo thereafterCancel anytime in 1 clickFree Explorer tier forever
What it covers
What this capability surfaces
A grounded list of the features and outputs the matching workspace surface delivers today. Each row below maps directly to the corresponding element of the live product — nothing is aspirational or invented.
Illustrative Capability View
01
Overall Rating
Composite score (0–100) with a letter grade (A through F) and a percentile rank within the rated universe.
Headline
02
Six sub-rating tiles
Growth, Valuation, Efficiency, Dividends, Momentum, and EPS Revisions — each with its own score, letter grade, and percentile rank.
03
Top-rated universe
Table listing every rated ticker sorted by composite score.
04
Sub-rating leaders
Top-rated symbol within each of the six dimensions.
05
Symbol picker
Apply the same view to any ticker in the rated universe.
How it works
Inputs, analysis, outputs
A high-level description of how the capability goes from raw inputs to the outputs you see inside the workspace.
01Step 1
Inputs
Public ticker fundamentals, price history, and analyst revision data for the rated universe.
02Step 2
Analysis
Each ticker is scored 0–100 on the six dimensions. Scores are combined into a composite Overall Rating. Letter grades are assigned by score threshold.
03Step 3
Outputs
An Overall Rating card, six sub-rating tiles, a sortable universe table, and a sub-rating leaders panel — all within the Vantage Stock Ratings workspace.
Illustrative Workspace View
See it in the workspace
Institutional Q·V·M factor scores, tri-factor radar wheels, and automated Value Trap detection inside the Vantage Factor Command Center.
Six-factor ratings
Illustrative workspace preview
Illustrative workspace view. Data and labels are shown for demonstration and research context only.
Example outputs
What a typical result looks like
Illustrative examples showing the kind of labels and values the workspace surface produces. Numbers shown are placeholders, not live recommendations.
IllustrativeOverall RatingComposite score · letter grade · percentile
IllustrativeUniverse tableAll rated tickers sorted by composite
IllustrativeSub-rating leadersTop ticker per dimension
IllustrativeSymbol pickerAny ticker in the rated universe
Example values shown above are illustrative. The workspace always displays real values where the underlying data source is available.
ILLUSTRATIVE WORKSPACE SNAPSHOT
Model + analyst context
Two independent readings surfaced side by side — model-based factor profile on the left, third-party analyst consensus on the right.
Model-based factor view
Internal multi-factor profile across six dimensions. Each tile is a neutral relative label — not a score or letter rating.
Overall factor profileBalanced
GrowthHigher relative score
ValuationLower relative score
EfficiencyBalanced
DividendsHigher relative score
MomentumMixed
EPS RevisionsBalanced
Relative labels reflect qualitative position within the rated universe; they are not a buy or sell implication.
Independent analyst-consensus context
Sentiment continuum from third-party analyst coverage, shown as a qualitative band.
Sentiment continuumMore positive · Mixed · More cautious
These are separate research measures and may point in different directions.
Use it responsibly
Limitations and responsible-use disclosures
Ratings are a snapshot built from the underlying inputs available at the time; they change as inputs change. They are decision support, not recommendations.
A higher composite score does not imply positive future returns, and no single rating is a buy or sell signal on its own.
Always combine rating context with current price, position size, and your own time horizon before acting. Markets involve risk and losses are possible.
This product provides information and research tools and does not provide personalized investment advice. Markets involve risk and losses are possible. You are responsible for your own investment decisions and the associated risk. Independently review any data, AI output, or rating before acting on it.
Ready when you are
Unlock the Full Quantitative Terminal.
Start your 3-day risk-free trial to access all 10 quantitative workspaces, daily Vantage Picks, and multi-horizon forward forecasts. Cancel anytime in 1 click.