
Back to VantageSYSTEMATIC STRATEGY SIMULATION

Vantage Quant: Systematic strategy backtester

Simulate algorithmic models across 5 years of live market data. Test Dual SMA, 50/200 Golden Cross, RSI Mean Reversion, and Breakout rules before risking real capital.

Evaluate plain-English performance outcomes, visual RSI oscillators, drawdown curves, and comprehensive trade logs with exact entry and exit dates.

3-Day full access trial · $24/mo thereafterCancel anytime in 1 clickFree Explorer tier forever
What it covers

What this capability surfaces

A grounded list of the features and outputs the matching workspace surface delivers today. Each row below maps directly to the corresponding element of the live product — nothing is aspirational or invented.

Illustrative Capability View
  1. 01
    Algorithmic Strategy Engine

    Simulate Dual SMA Crossover, 50/200 Golden Cross, RSI (14) Mean Reversion, and Price Breakout strategies over customizable horizons.

  2. 02
    Visual Technical Oscillators

    Synchronized visual sub-charts with 30 Oversold Buy and 70 Overbought Sell thresholds plotted alongside price action.

  3. 03
    Plain-English Performance Summary

    Human-readable dollar outcomes (e.g. $10,000 grew to $16,520 with RSI vs. benchmark -43% drawdown) for instant clarity.

  4. 04
    Comprehensive Trade Log

    Every simulated trade logged with entry date, exit date, holding period, execution price, and realized profit or loss.

  5. 05
    Risk & Drawdown Metrics

    Automated computation of Maximum Drawdown, Sharpe Ratio, Profit Factor, Win Rate, and Strategy Excess Alpha.

How it works

Inputs, analysis, outputs

A high-level description of how the capability goes from raw inputs to the outputs you see inside the workspace.

  1. 01Step 1

    Strategy Selection

    Choose an algorithmic trading model (RSI, Golden Cross, Breakout) and configure time horizon and initial capital.

  2. 02Step 2

    Historical Execution

    The engine simulates buy/sell rule execution bar-by-bar across 5 years of historical price candles with zero lookahead bias.

  3. 03Step 3

    Performance Attribution

    Generates comparative equity curves, trade logs, risk-adjusted returns, and visual indicator overlays.

Illustrative Workspace View

See it in the workspace

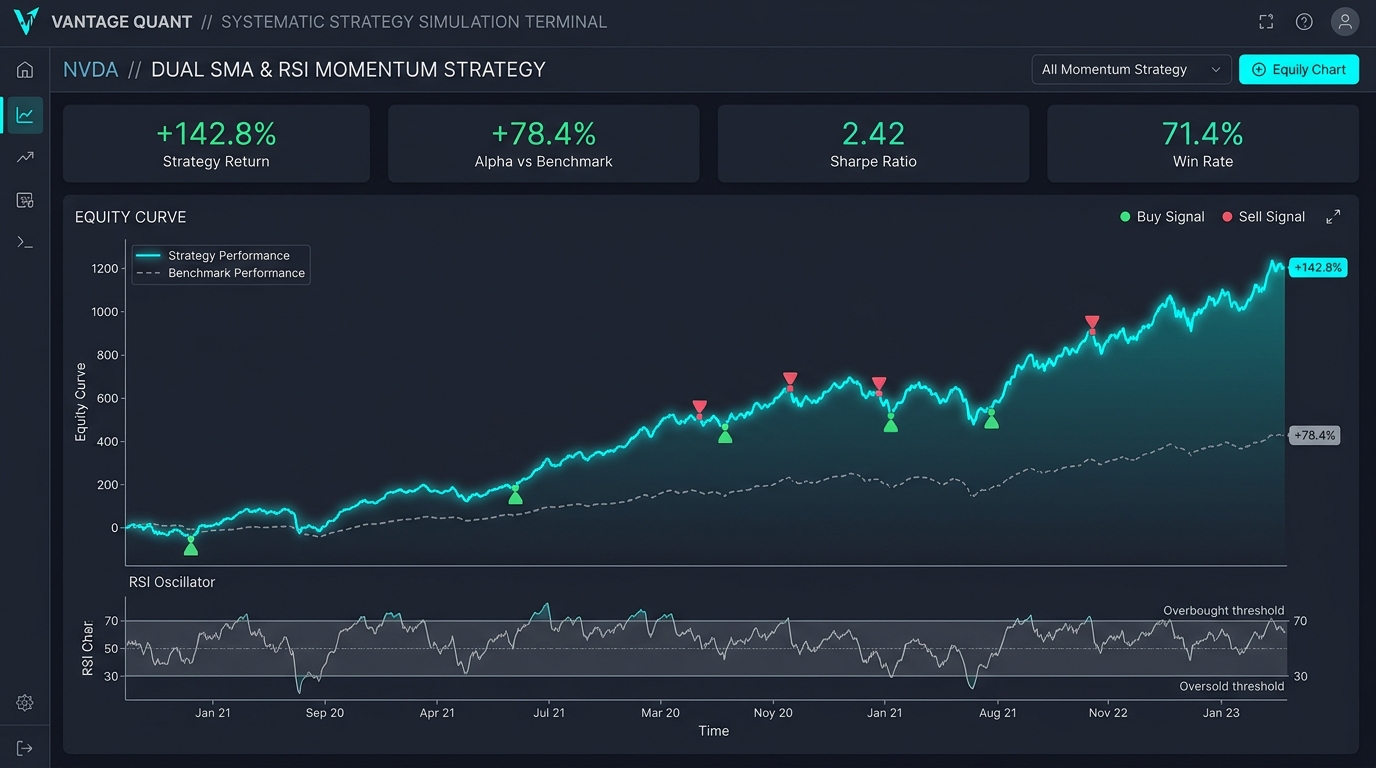
Rule-based systematic backtesting terminal with visual oscillator triggers and historical trade execution logs.

Vantage Quant: Systematic strategy backtester

Illustrative workspace preview
Vantage Quant Backtesting Terminal with RSI oscillator and Net Alpha tracking.

Illustrative workspace view. Data and labels are shown for demonstration and research context only.

Example outputs

What a typical result looks like

Illustrative examples showing the kind of labels and values the workspace surface produces. Numbers shown are placeholders, not live recommendations.

  • IllustrativePortfolio Outcome$10,000 → $16,520 (+65.2%)
  • IllustrativeStrategy Alpha+108.2% vs Buy & Hold (-43.0%)
  • IllustrativeMax Drawdown-14.2% Strategy vs -48.1% Benchmark
  • IllustrativeWin Rate71.4% Profitable Trades (10/14)
  • IllustrativeActive IndicatorRSI(14) · Oversold 30 / Overbought 70

Example values shown above are illustrative. The workspace always displays real values where the underlying data source is available.

ILLUSTRATIVE WORKSPACE SNAPSHOT

Algorithmic simulation

Empirical rule testing across historical price candles to measure strategy alpha and drawdown mitigation.

Strategy performance profile

Illustrative simulation metrics for RSI Mean Reversion.

  • Total Return+65.2% · Strategy
  • Benchmark Return-43.0% · Buy & Hold
  • Max Drawdown-14.2% · Protected
  • Win Rate71.4% · 10 of 14

Simulated over 5-year historical daily price series.

Execution parameters

Technical rules and risk controls applied in simulation.

  • Model TypeRSI Mean Reversion
  • Lookback Period14 Candles
  • Buy TriggerRSI Crosses Below 30
  • Sell TriggerRSI Crosses Above 70

Audited bar-by-bar trade log generated for every run.

Illustrative research context only. It is not personalized investment advice, a recommendation, a price target, or a guarantee of future results.

All backtest simulations run interactively inside the Vantage Quant Backtest workspace.

Use it responsibly

Limitations and responsible-use disclosures

  • Backtested performance results are hypothetical, mathematically modeled, and do not represent actual trading in live accounts.
  • Simulations do not account for market liquidity constraints, order execution slippage, commissions, margin interest, or tax impacts.
  • Past simulated performance is not indicative of future investment returns. Always employ sound position sizing and risk discipline.

This product provides information and research tools and does not provide personalized investment advice. Markets involve risk and losses are possible. You are responsible for your own investment decisions and the associated risk. Independently review any data, AI output, or rating before acting on it.

Ready when you are

Unlock the Full Quantitative Terminal.

Start your 3-day risk-free trial to access all 10 quantitative workspaces, daily Vantage Picks, and multi-horizon forward forecasts. Cancel anytime in 1 click.