
Overall profile
Qualitative state for the illustrative portfolio as a whole.
- Profile stateBalanced · Concentrated · Diversified
A composite grade for your portfolio plus severity-coded warnings on concentration, valuation, risk, and quality.
Each holding contributes to a weighted factor score, so the grade reflects the portfolio as a whole — not a single stock pulled out of context.
A grounded list of the features and outputs the matching workspace surface delivers today. Each row below maps directly to the corresponding element of the live product — nothing is aspirational or invented.
Letter grade (A through F) with an overall 0–100 score.
High / medium / low severity covering concentration, valuation, risk, and quality.
Enumerated list of identified portfolio strengths.
Per-factor view across all holdings, with each factor shown as a letter grade.
Sector concentration breakdown showing each sector's weight within the portfolio.
A high-level description of how the capability goes from raw inputs to the outputs you see inside the workspace.
The active portfolio's holdings, quantities, and the live factor grades for each ticker.
Holdings are weighted by notional size, rolled up into per-factor averages, and screened for sector and position concentration above configurable thresholds.
A composite grade, severity-coded warnings, a strengths list, a per-factor exposure panel, and a sector concentration view.
Composite health grade, multi-factor exposure breakdown, concentration risk warnings, and sector allocation in the Vantage Portfolio Health workspace.
Portfolio health scoring
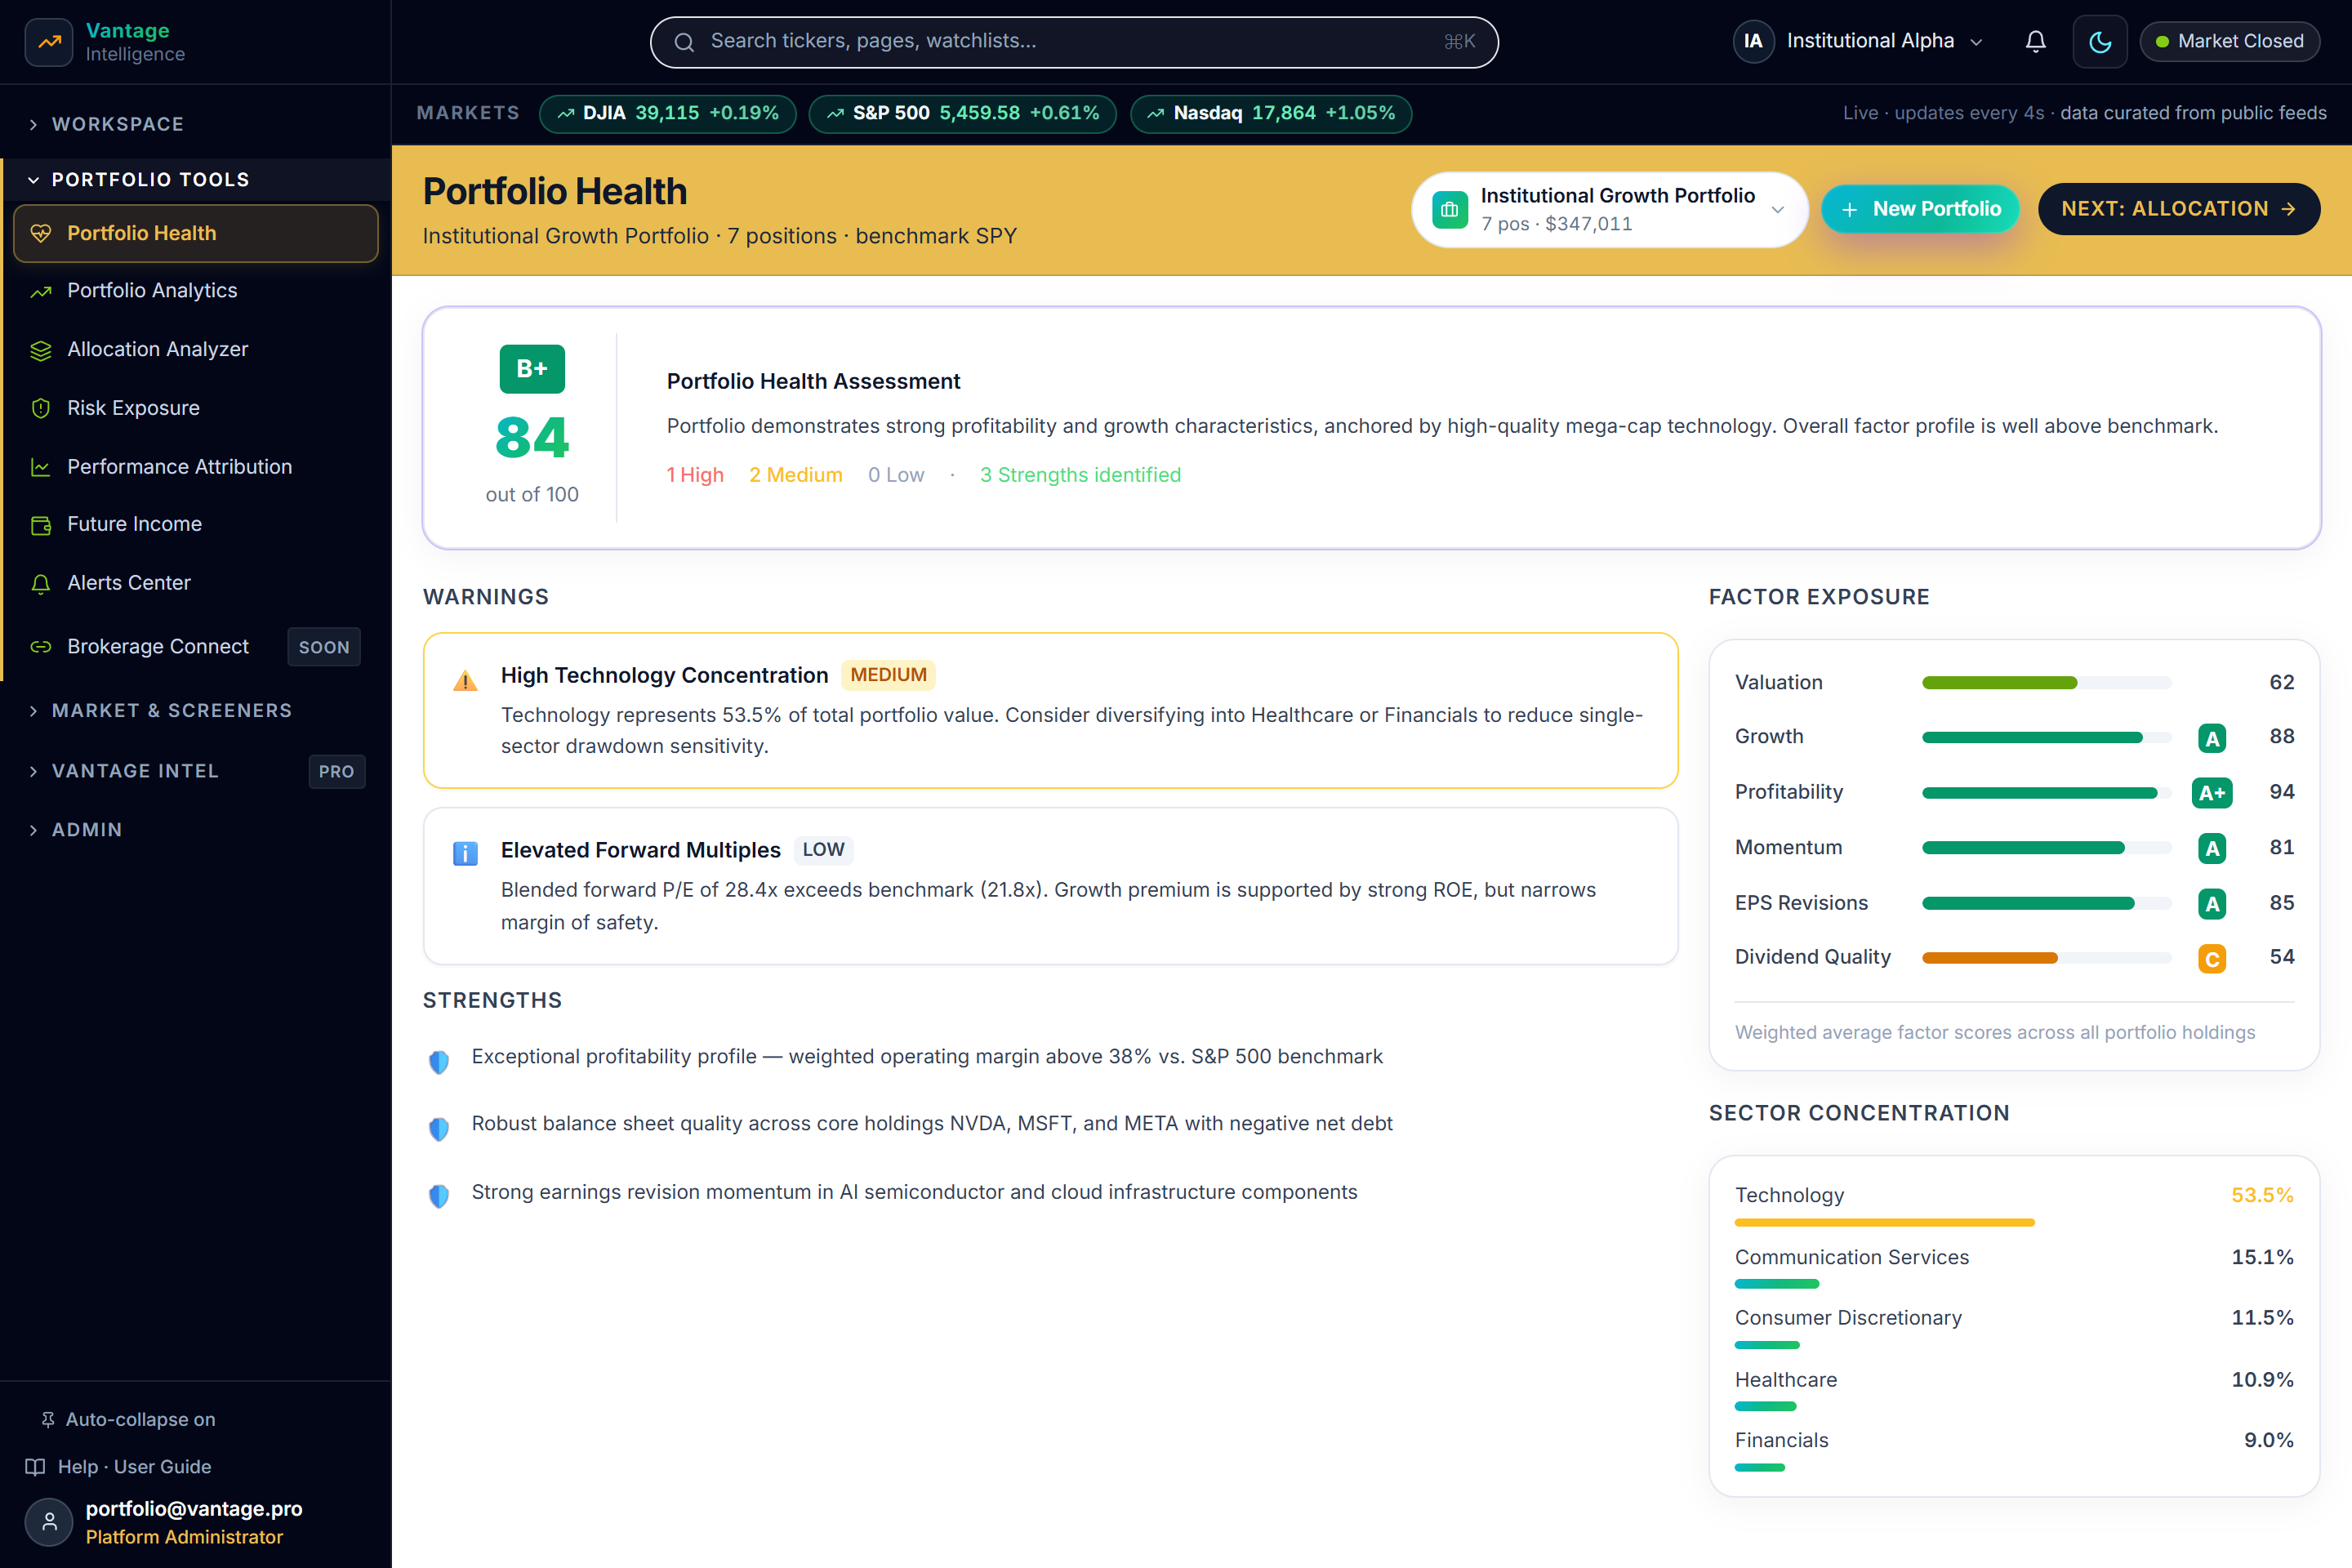
Illustrative workspace view. Data and labels are shown for demonstration and research context only.
Illustrative examples showing the kind of labels and values the workspace surface produces. Numbers shown are placeholders, not live recommendations.
Example values shown above are illustrative. The workspace always displays real values where the underlying data source is available.
Overall profile with an exposure panel across the four risk dimensions.
Qualitative state for the illustrative portfolio as a whole.
Qualitative bands across the four exposure dimensions for the illustrative portfolio.
This product provides information and research tools and does not provide personalized investment advice. Markets involve risk and losses are possible. You are responsible for your own investment decisions and the associated risk. Independently review any data, AI output, or rating before acting on it.
Start your 3-day risk-free trial to access all 10 quantitative workspaces, daily Vantage Picks, and multi-horizon forward forecasts. Cancel anytime in 1 click.