3-Day full access trial · $24/mo thereafterCancel anytime in 1 clickFree Explorer tier forever
What it covers
What this capability surfaces
A grounded list of the features and outputs the matching workspace surface delivers today. Each row below maps directly to the corresponding element of the live product — nothing is aspirational or invented.
Illustrative Capability View
01
Day-change ranking
Day-change percentage for each sector ETF in the covered set.
Headline
02
Performance sort
Sort by performance so the leading and lagging sectors sit at the top and bottom of the table.
03
Magnitude bars
Horizontal magnitude bars sized to the absolute move, coloured by direction.
04
Sector card grid
Price tile and data-source tile per sector.
05
As-of timestamp
As-of timestamp so you know which trading day the view reflects.
How it works
Inputs, analysis, outputs
A high-level description of how the capability goes from raw inputs to the outputs you see inside the workspace.
01Step 1
Inputs
Live quote data for the sector ETFs in the covered set.
02Step 2
Analysis
Day-change percentage is calculated from the previous close, with NaN or missing values surfaced as em-dashes rather than zeroed.
03Step 3
Outputs
A day-change ranking chart with horizontal bars plus a per-sector card grid showing symbol, price, and data source.
Illustrative Workspace View
See it in the workspace
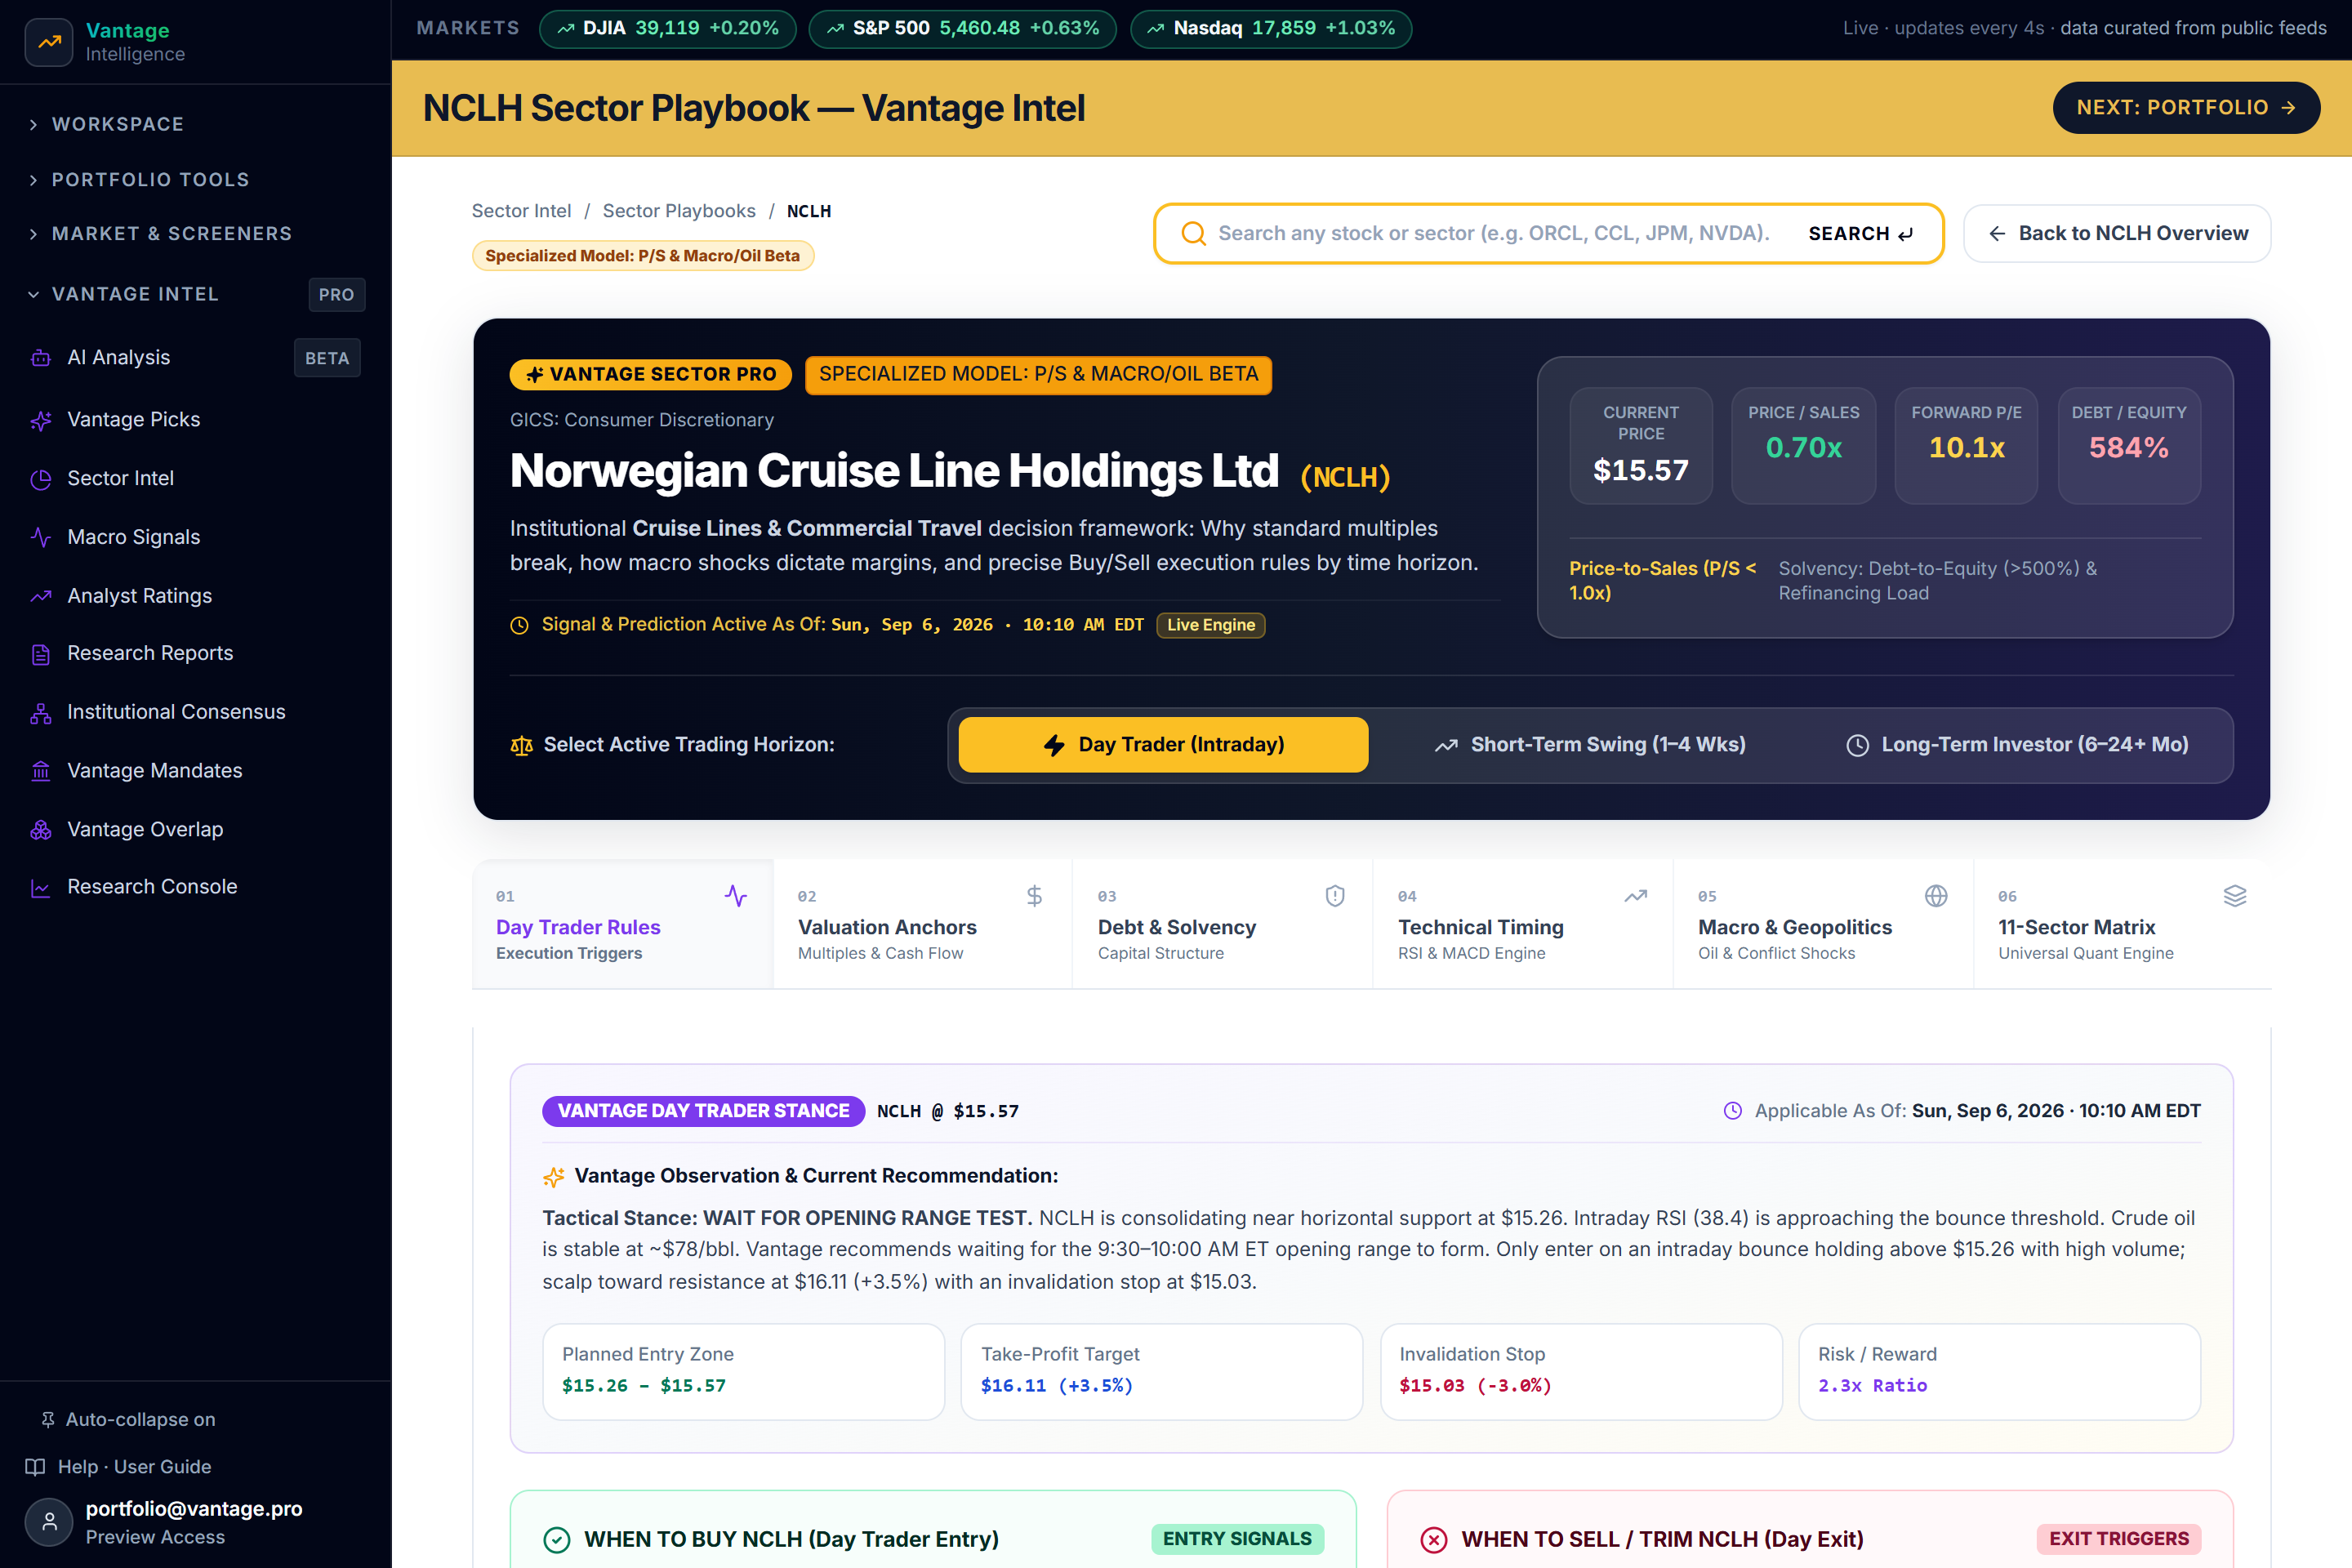
Tactical playbooks for all 11 GICS sectors across 3 synchronized trading horizons in the Vantage Sector Intel workspace.
Sector day-change ranking
Illustrative workspace preview
Illustrative workspace view. Data and labels are shown for demonstration and research context only.
Example outputs
What a typical result looks like
Illustrative examples showing the kind of labels and values the workspace surface produces. Numbers shown are placeholders, not live recommendations.
IllustrativeSector ETFSymbol + sector name
IllustrativeDay changeIntraday percentage
IllustrativeDirectionPositive or negative magnitude
IllustrativePrice tileCurrent price per sector
IllustrativeSource tileData source attribution
Example values shown above are illustrative. The workspace always displays real values where the underlying data source is available.
ILLUSTRATIVE WORKSPACE SNAPSHOT
Illustrative sector context
Two balanced sector-group cards · qualitative labels only · no period returns.
Sector groups A–C
Three illustrative sector groups · qualitative labels.
Sector group
Relative context
Factor tilt
Sector group A
Above median
Quality ↑
Sector group B
Near median
Value ↑
Sector group C
Below median
Momentum ↓
Sector group A
Relative context
Above median
Factor tilt
Quality ↑
Sector group B
Relative context
Near median
Factor tilt
Value ↑
Sector group C
Relative context
Below median
Factor tilt
Momentum ↓
Sector groups D–E
Two illustrative sector groups · qualitative labels.
Sector group
Relative context
Factor tilt
Sector group D
Near median
Quality ↑
Sector group E
Above median
Growth ↑
Sector group D
Relative context
Near median
Factor tilt
Quality ↑
Sector group E
Relative context
Above median
Factor tilt
Growth ↑
Use it responsibly
Limitations and responsible-use disclosures
Sector Intel is a day-change snapshot, not a recommendation. Past sector performance does not predict future leadership.
A sector that leads one session can lag the next. Use this view alongside your portfolio context and risk profile.
Markets involve risk. Sector exposure should be set deliberately, not by chasing the day's leader.
This product provides information and research tools and does not provide personalized investment advice. Markets involve risk and losses are possible. You are responsible for your own investment decisions and the associated risk. Independently review any data, AI output, or rating before acting on it.
Ready when you are
Unlock the Full Quantitative Terminal.
Start your 3-day risk-free trial to access all 10 quantitative workspaces, daily Vantage Picks, and multi-horizon forward forecasts. Cancel anytime in 1 click.