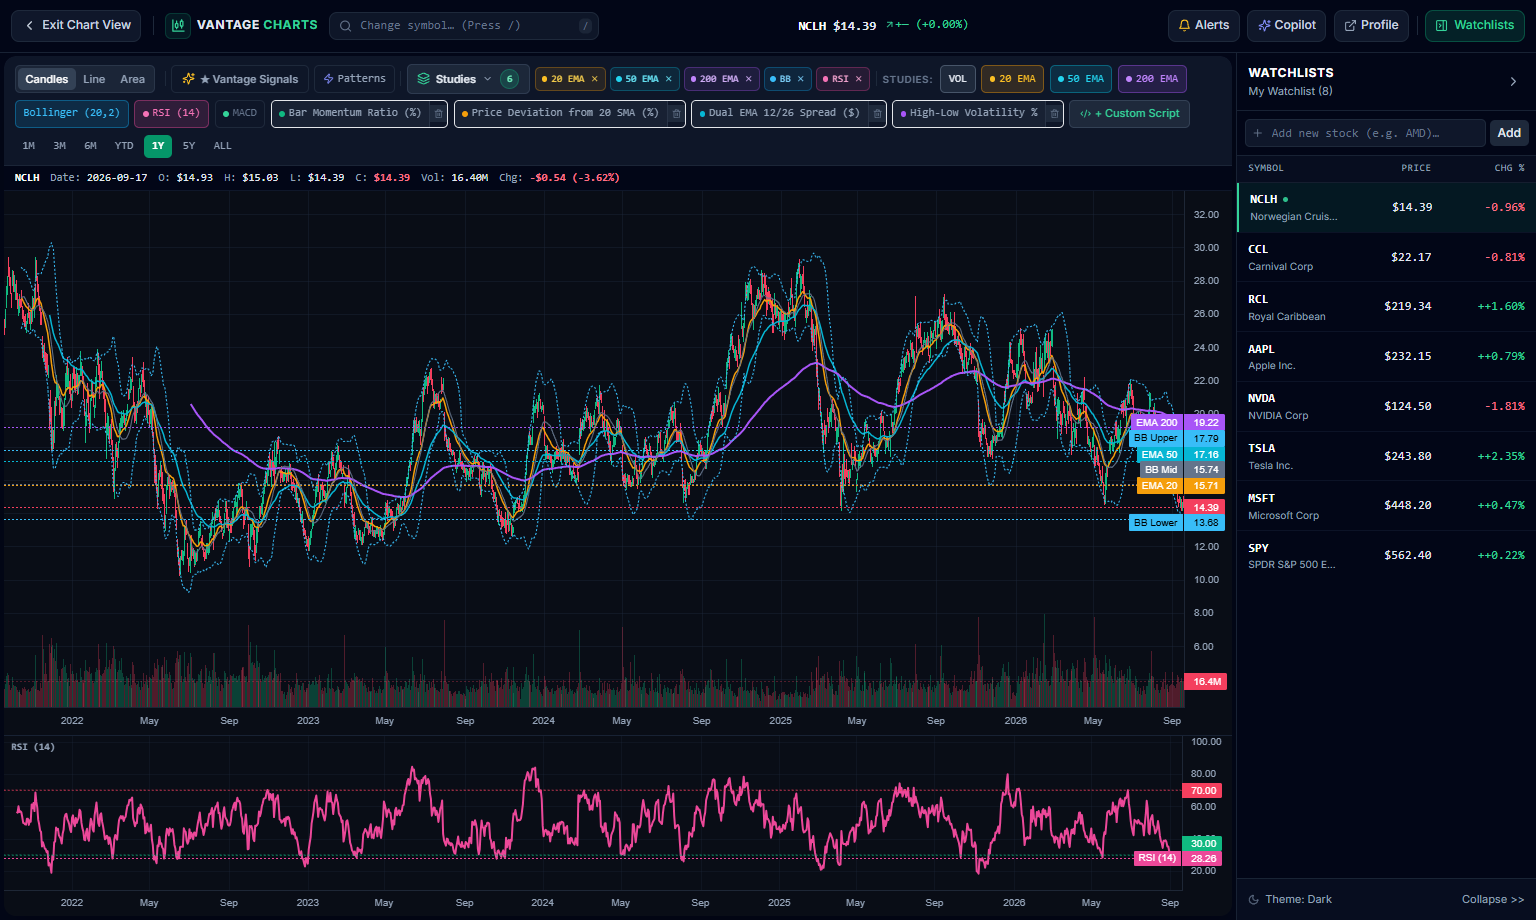
Institutional-grade technical canvas featuring 16+ core indicators, multi-study composition, BYOC JavaScript indicator scripting, and quantitative signal overlays.
Analyze price action across tick, minute, and daily horizons with custom user scripts, volatility bands, and quantitative factor ratings — completely watermark-free.
3-Day full access trial · $24/mo thereafterCancel anytime in 1 clickFree Explorer tier forever
What it covers
What this capability surfaces
A grounded list of the features and outputs the matching workspace surface delivers today. Each row below maps directly to the corresponding element of the live product — nothing is aspirational or invented.
Illustrative Capability View
01
16+ Technical Studies
SMA, EMA, RSI, MACD, Bollinger Bands, ATR, Supertrend, Stochastic, VWAP, Ichimoku, Parabolic SAR, and Volume Profile.
02
Multi-Study Composition
Run up to 3 concurrent technical studies on Free Explorer, or unlimited concurrent studies and sub-panes on Alpha Pro.
03
BYOC Indicator Code Studio
Write and execute custom technical indicators in pure JavaScript with hot-reloading and real-time canvas overlays.
Headline
04
Proprietary Quant Signals
Alpha Picks conviction markers, 3-way factor divergence alerts, and quantitative valuation band overlays.
05
Pattern Recognition
Algorithmic detection of candlestick reversals, Doji, Hammers, Engulfing patterns, and volatility squeezes.
06
Zero-Watermark Workstation
High-contrast, uncluttered dark-mode canvas built for professional technical analysis with zero third-party watermarks.
How it works
Inputs, analysis, outputs
A high-level description of how the capability goes from raw inputs to the outputs you see inside the workspace.
01Step 1
Data Synchronization
Sub-millisecond aggregation of historical OHLCV candles across NYSE, NASDAQ, ETFs, and major indices.
02Step 2
Engine Calculation
Client-side vectorized math computing moving averages, oscillators, volatility channels, and custom user algorithms.
03Step 3
Quant Synthesis
Technical patterns are aligned with audited 6-factor composite grades to filter optical noise from genuine alpha.
Illustrative Workspace View
See it in the workspace
Multi-study technical analysis, BYOC custom JavaScript indicator coding, and proprietary quant signal markers in the Vantage Interactive Chart workspace.
Interactive Chart Workstation
Illustrative workspace preview
Illustrative workspace view. Data and labels are shown for demonstration and research context only.
Example outputs
What a typical result looks like
Illustrative examples showing the kind of labels and values the workspace surface produces. Numbers shown are placeholders, not live recommendations.
IllustrativeDual EMA Cross50 EMA ($438.20) / 200 EMA ($412.50) · Golden Cross
Illustrative multi-study signals across primary canvas.
Trend RegimeBullish · 50 EMA > 200 EMA
RSI Momentum48.6 · Equilibrium Range
MACD SignalBullish Centerline Crossover
Volatility BandCompressed Channel
Vectorized indicators computed in real-time across OHLCV bars.
Workstation capabilities
Institutional technical tools available by tier.
Free Explorer TierUp to 3 Concurrent Studies
Alpha Pro TierUnlimited Indicators
BYOC StudioCustom JavaScript Indicators
Quant OverlaysVantage Alpha Signal Markers
Zero third-party watermarks across all tiers.
Use it responsibly
Limitations and responsible-use disclosures
Technical indicators, moving averages, and chart overlays represent mathematical transformations of historical price action and volume, and do not guarantee future returns.
Free Explorer accounts support up to 3 concurrent technical studies. Unlimited indicators, BYOC JavaScript scripting, and quant signals require an active Alpha Pro subscription.
Technical patterns should be evaluated alongside corporate earnings, SEC filings, factor ratings, and disciplined position sizing.
This product provides information and research tools and does not provide personalized investment advice. Markets involve risk and losses are possible. You are responsible for your own investment decisions and the associated risk. Independently review any data, AI output, or rating before acting on it.
Ready when you are
Unlock the Full Quantitative Terminal.
Start your 3-day risk-free trial to access all 10 quantitative workspaces, daily Vantage Picks, and multi-horizon forward forecasts. Cancel anytime in 1 click.